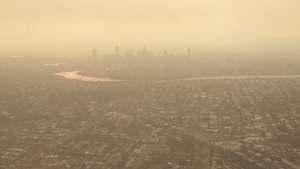
Brisbane, Australia shrouded in bushfire smoke
“Air is composed of 78 per cent nitrogen, 21 percent oxygen and 0.9 percent argon. Analysis of any air sample in Australia, be it from an industrial city or from the outback, will still have the same overall composition. It is the composition of the last 0.1 percent of the air together with the suspended particles which really determines the air quality”- (Ferrari, 1986)
With the current devastating bushfires in Australia, there are many reports of the hazardous background air quality in major cities, country towns and surrounding areas. As reporters compare the atmospheric conditions to that of Beijing and other smoggy city areas (Roe, 2019), this environmental crisis raises an interesting question in the public eye. At what point will the air be safer to breathe? Or, in other words, what constitutes a background air quality that is deemed “good”?
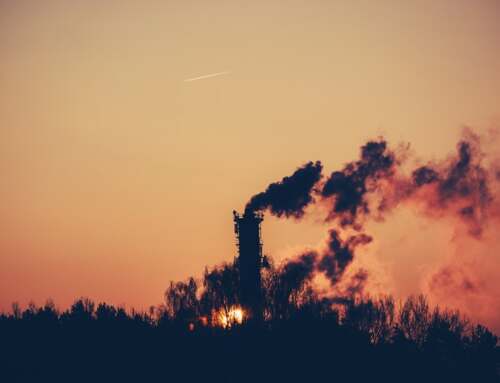
A simple answer is that “good” air is lacking in all of the compounds and particles that would otherwise make the air hazardous to breathe. A more suitable phrase would be clean or pure air. However, this answer is more complicated than one might first intuit.
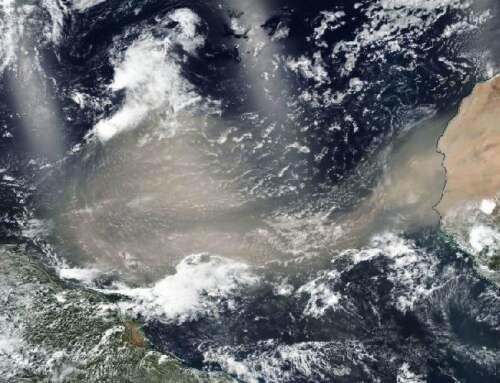
The concentration of compounds involved in determining air quality are miniscule. The composition of the Earth’s atmosphere (pictured below) contains many gases. Often, reviews of air composition do not bother to include the tiny percentage of other trace gasses that make up many pollutants. When measuring ambient air quality, detection levels need to be at the parts per million or parts per billion scale.

Composition of the Earth’s atmosphere. Numbers are mainly from 2000 with CO2 and CH4 from 2019. No single source is represented in this graph. (Wikimedia Commons, 2019)
In a measurement of ambient air, there is an extensive collection of compounds that these trace gasses could be. Because the possible types of pollutant are so varied, it is useful to categorize them. For Australia, they are categorized into three classes in order to help define ambient air quality (Victoria Government, 2001).
Class 1 compounds are the most well documented in terms of emission measurements. These are common or widely distributed compounds such as SO2, NO2, Lead and CO. This class represents well established environmental pollutants of the air. Dust and other particles (including those of 10µm diameter) are also categorized here due to their clear detriment to respiratory health. Despite their commonality, we can see that their concentration in the Earth’s atmosphere does not even show on the minute scale of the pictured graph. This reinforces the importance of measuring to higher resolutions in order to properly characterise healthy air quality.
Toxic and odorous compounds are delegated to Class 2. These are the compounds that represent health hazards to those breathing them due to their poisonous or discomforting nature. Asbestos, arsenic, cyanide and ammonia are residents in this category, but the list goes on. Highly toxic or carcinogenic materials are classified in their own category, Class 3. Often these minority compounds are difficult to quantify and so are compared relative to one another in terms of severity. This helps establish thresholds for new or unorthodox health hazards.
The measurement and cumulative levels of each of these unhealthy compounds are used to establish their background level for safe ambient air quality. This is often a difficult process, since some compounds are easier to detect than others. Many compounds may also undergo chemical reactions and transform into other pollutants over time. To account for this, average concentration levels over standardized time periods are measured and a certain number of outlier days are eliminated. For example, the spring of 2019 would be flagged as an unusually high level of particulate matter from the smoke hanging over NSW. When new industry projects are proposed, their potential emissions are calculated and then included to the cumulative air budget to determine if they will exceed safe air quality.
With conditions as they are likely to continue, however, the bushfire filled spring of 2019 may not remain an outlier to the average background air quality (Judd & Taylor, 2019). We should take this as an incentive to reflect on and minimise even the tiniest emission levels. If the 0.1% of remaining atmosphere composition is consistently filled with higher background emissions, then the tolerance for any pollutant threshold exceedances should be slimmer. Constant measurement and auditing of the emissions being released into the environment must be maintained so that in the future, we can ensure that the invisible slice of the pie graph is safe for us all to breathe.
References
Ferrari, L. (1986). Air Quality – What is it? In L. Ferrari, D. Johnson, & H. Wortham, Air Pollution Measurement. A Practical Guide to Sampling and Analysis (pp. 1-6). Eastwood: Clean Air Society.
Henson, B. (2017, March 22). It’s Time to Give Air Quality the Attention It Deserves. Retrieved from Weather Underground: https://www.wunderground.com/cat6/it%E2%80%99s-time-give-air-quality-attention-it-deserves.
Judd, B., & Taylor, C. (2019, December 10). Smoke and bushfires are the new norm, so how do we beat the ‘airpocalypse’? Retrieved from ABC News: https://www.abc.net.au/news/2019-12-07/nsw-fire-smoke-air-pollution-how-our-lives-will-need-to-change/11761098.
Roe, I. (2019, November 19). Sydney air quality worse than Beijing as fires persist. Retrieved from ABC’s The World Today: https://www.abc.net.au/radio/programs/worldtoday/sydney-air-quality-worse-than-beijing-as-fires-persist/11717262.
Schofield, R., & Stevenson, M. (2017, January 19). Australia needs stricter rules to curb air pollution, but there’s a lot we could all do now. Retrieved from The Conversation: http://theconversation.com/australia-needs-stricter-rules-to-curb-air-pollution-but-theres-a-lot-we-could-all-do-now-71075.
Victoria Government. (2001, December 21). State Environment Protection Policy (Air Quality Management). Environment Protection Act 1970. Melbourne, Victoria, Australia: Victoria Government Gazette.
Wikimedia Commons. (2019, November 28). Atmosphere of Earth. Retrieved from Wikipedia: https://en.wikipedia.org/wiki/Atmosphere_of_Earth#cite_note-handbook-4.


